Jun 8, 2020 | Documentation
Implementing Oracle’s® Primavera™ P6 in an enterprise or global environment is typically a costly and time-consuming endeavor and should be carefully planned with specific business goals in mind.
After many years of use and hundreds of projects later, however, a Primavera™ P6 Production database if not properly managed can become a muddy mess of global information used to group, sort, report, collect performance, and support global change. The maintenance of a Primavera™ P6 database is more than just adding users and creating projects. It takes careful consideration prior to implementation as to how the application will be used, how often external information will be imported, how data archival will be managed, how the global data will be configured and maintained, just to name a few.
This paper will provide some best practice recommendations which can be used to manage a Primavera™ P6 Production environment and help maintain order and avoid the chaos.
- Provide a minimum of two Primavera™ P6 databases (databases in a Microsoft® SQL Server or tablespaces in an Oracle® server) for the Production environment. One database meant to contain the production data and one to use as an acceptance or ‘cleansing’ area. This will help prevent pollution of the production database with non-production global data such as codes, calendars, resources, and user defined fields that could inadvertently be imported from external Primavera™ P6 .xer or XML files.
- Maintain separate Production databases for managing different types of projects. An example would be Turnaround versus Capital Projects. Turnaround resources and calendars are typically dedicated to specific events whereas Capital Projects will use an entirely different set of resources, calendars and codes. Management of data in a single database for these two distinctly different project types is cumbersome. Training should also take place in a separate database and not in a Sandbox Enterprise Project Structure (EPS) node in Production.
- Utilize intelligent, also known as ‘smart’ coding, for global data, project IDs and activity IDs. An example would be to use TA_ for all managed turnaround activity codes and use Project IDs containing the turnaround unit(s) acronym and year of the event. Any of this global data should be locked down and managed through a formal change control process.
- Limit the use of user defined fields (UDFs) to support global change or indicators. UDFs are user editable fields and as such can be changed. Try to not utilize for project critical data such as equipment numbers or other data that is more suited to activity coding since you are one key click away from wiping out information associated with that activity. Also try to control the growth of the number of UDFs by creating a subset sometimes referred to as ‘Z’ fields. These ‘Z’ fields could be used for temporary data open for general use but would be cleansed periodically to manage growth and database performance impacts. A UDF text field is 255 characters long no matter how many characters are actually used (e.g., a two character value still takes up 255 characters in the database table) in the field.
- Understand that the management of Primavera™ P6 users in the database is essential not just from a data security and access perspective but also from a licensing perspective. Primavera™ P6 is predominantly sold on a per-user license basis and if a 25 user license pack is purchased, then by license agreement, no more than 25 users can be logged into the production database at any one time. Proper management of user licensing is not only needed for legal purposes but can also help prevent purchasing more licenses than needed.
- Managing the list of code and values, resource/role dictionaries, and calendars can for the most part be done from the Primavera™ P6 client or Primavera™ P6 Web interface. However managing the relationship of this data with the individual projects and activities would be extremely complex if there were thousands of activities and associated coding and resource assignments. This knowledge is best gathered from direct SQL queries to the data residing in the Primavera™ P6 database. Examples of these queries can be found in the My Oracle Support* knowledgebase.
- Keep in the loop on patches that are occurring to the Production environment infrastructure; in particular the database servers and web application servers. Even though these patches and updates are not happening in Primavera™ P6 they can cause inadvertent impacts to Primavera™ P6. Java Runtime Engine (JREs) updates are notoriously finicky and are by no means as backward compatible as they are claimed to be. Keep cognizant of the tested configuration of the particular Primavera™ P6 version and fully test updates prior to allowing them to be rolled into production.
- Create a concise data backup and archival strategy during the course of the implementation and prior to rollout. Too often backing up of data is strictly thought of as a DBA concern and no further thought is made as to what happens if you lose or corrupt a project, critical layout or report and the only way to recover these is to do a full database recovery. This is both time consuming and a heavy impact on other users in the database especially if hours or days’ worth of work is lost across the user community. Create a simple file structure on your laptop or better yet in a SharePoint™ repository to export and store your projects, layouts and reports in case you need to recover from a corruption.*https://support.oracle.com

Jun 8, 2020 | Documentation
Managing People On Board (POB) on Offshore Platforms
The main limitation when scheduling shutdowns or project work on an offshore platform or vessel at sea is the amount of workers that can be on the platform or vessel at any given time. An offshore platform is an isolated structure, usually miles from the coast that can only be accessed or exited by ship or helicopter. Regardless if a worker is on their active shift or their off hours, their presence on board has to be accounted for at all times in case of an emergency. Evacuation boats are installed on opposite sides of the platform allowing alternate routes of escape and a redundant number of seats are allocated for the entire crew.
The number of workers on board of a platform or vessel at sea is known as POB (people on board). This number depends on the amount of beds available onboard and the amount of seats available in the evacuation boats.
While scheduling a shutdown or a project, this POB number includes Operations and Support (in this category are the Facility Manager, Operators, Radio Operator, Paramedic and Safety Officer, Cooks, Deck Hands, Platform Crane Operators); the TAR or Project Management Team (Project Manager, Safety Officer, QAQC Inspector, Construction Manager(s) and Materials/Logistic Coordinator) and the craft personnel needed to perform the repairs or improvements required by the project. It’s necessary to maintain the Operations, Support and Management Team to the minimum amount necessary to support the crafts in a safely and efficient manner.
During the decommissioning and commissioning of the systems affected by the shutdown or project, crews in addition to the mechanical crews, will be required to blind, flush, purge, degas, pressure test and restore equipment and piping. For jobs that require confined space entry, a specialized rescue team is usually a requirement from the Safety Department. All of these additional resources should be considered when computing daily POB.
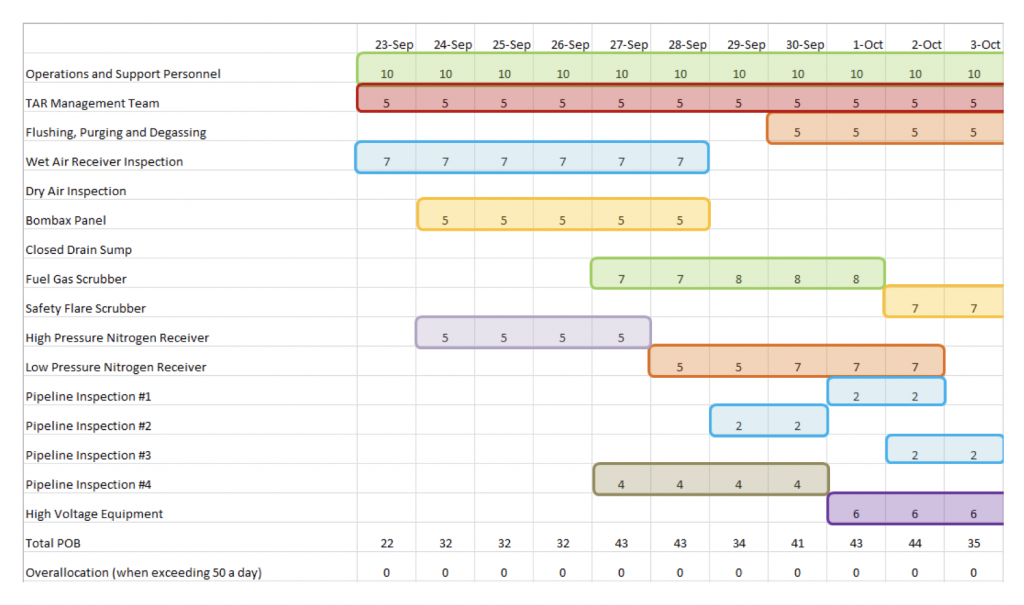
When working on the project schedule, it’s very helpful to create an Excel spreadsheet that calculates the daily POB based on the estimated amount of men per day required to complete each task. This is a time saving exercise that requires input from the planners and craft supervisors and helps the scheduler to create better relationships and sequencing between the tasks in the schedule.
Many scenarios may be considered based on priority, system availability and/or resource requirements.
After sequencing the work activities and creating the required relationships between tasks, POB requirements can be visualized in P6 by utilizing the following method:
- Create a resource named “Daily Operations and Support” and use the number of Operations and Platform Support personnel onboard as the maximum units/time.
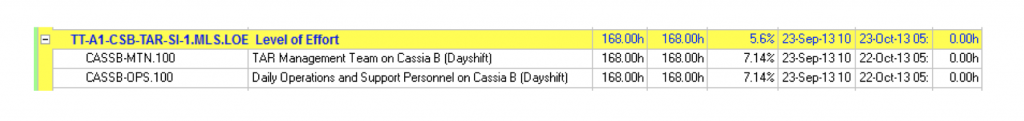
- Create a Level of Effort activity from Shutdown Start (SS) to Shutdown Finish (FF) using that resource and the maximum units/time as the remaining units/time.
- Create a resource named “TAR Management Team” and use the number of supervision and TAR support personnel onboard as the maximum units/time.
- Create a Level of Effort activity from Shutdown Start (SS) to Shutdown Finish (FF) using that resource and the maximum units/time as the remaining units/time.
5. Build a stacked histogram showing each of the resources as a segment and placing the TAR Management Team and Daily Operations and Support Personnel at the bottom of the histogram.
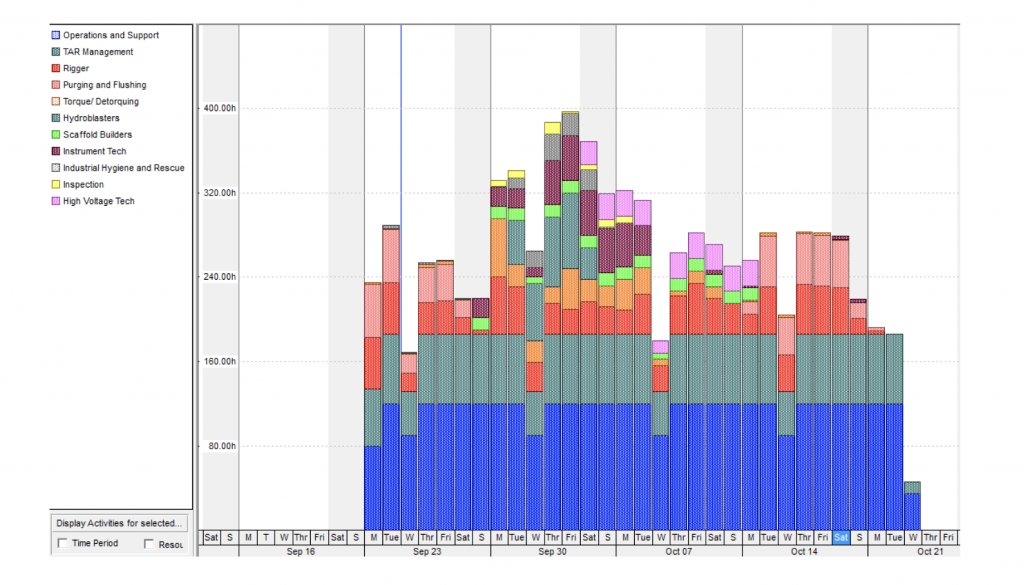
Knowing that the maximum POB number is 50 and that the scheduled hours per day are 10, we can confirm visually that the daily scheduled hours don’t exceed 500 per day and in the event additional or special resources are required to complete a task, we can arrange a helicopter or boat trip to supplement the crew already onboard.
Other considerations when scheduling resources restricted by a POB:
- Rotations: Depending on the length of the project or shutdown, the different crews – Operations and Construction – could be subject to rotations, every week or two weeks; that limits the productivity for a particular day of the week. On the day the rotation takes place, the crews are transported from and to shore by boat or helicopter and the new crews go thru safety orientations and work turnovers. The calendar in P6 should be adjusted to reflect the loss of productivity on the rotation day(s).
- Special Resources: During the execution phase, special resources like Inspectors, Engineers, High Voltage Electricians, and Valve Technicians, etc. will be required to come onboard for specific tasks. It is important to emphasize in the schedule all the tasks that require a special resource and to schedule their availability onboard in an efficient manner.
- Mansleepers/Additional Beds: It is possible to install temporary living quarters to accommodate more workers on the platform or vessel at sea as long as additional boats are available for their safe evacuation in case of an emergency.
- NUI (Normally Unoccupied Installations): These are offshore platforms that are not intended for continuous occupancy and don’t provide living accommodations for Operational or Maintenance personnel. They present logistical challenges of transporting and accommodating the complete crews during the event.
- Helicopter Flights: When budget allows it, daily helicopter flights are available to transport personnel on day trips to the platform. Helicopters usually fly only during daylight hours with a maximum capacity of 7 or 8 passengers, depending on helicopter model. These flights are subject to good weather and heliport flight schedule. The cost of daily helicopter flights to the offshore platform is very high and a good schedule has to be prepared and maintained during execution to avoid unnecessary trips and delays in production.
For more information on scheduling shutdowns or project work on an offshore platform or vessel at sea, contact TEPCO to speak with one of our Field Consultants at (281) 428-3726.
Jun 5, 2020 | Documentation
Utilizing Different Methods to Remove Logic in Primavera P6
There are multiple ways to remove logic from a P6 schedule. Below are four examples of how this can be accomplished.
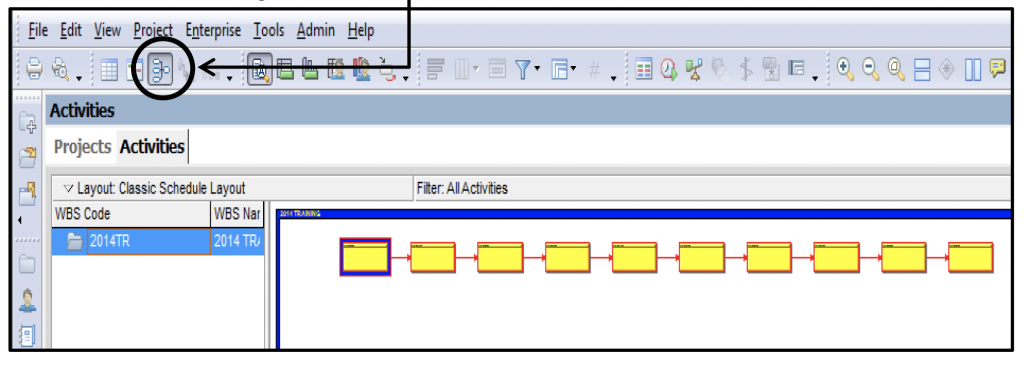
Method #1 – Using the Relationships tab
- Select the Relationships tab.
- Select the Activity that needs to have a relationship removed.
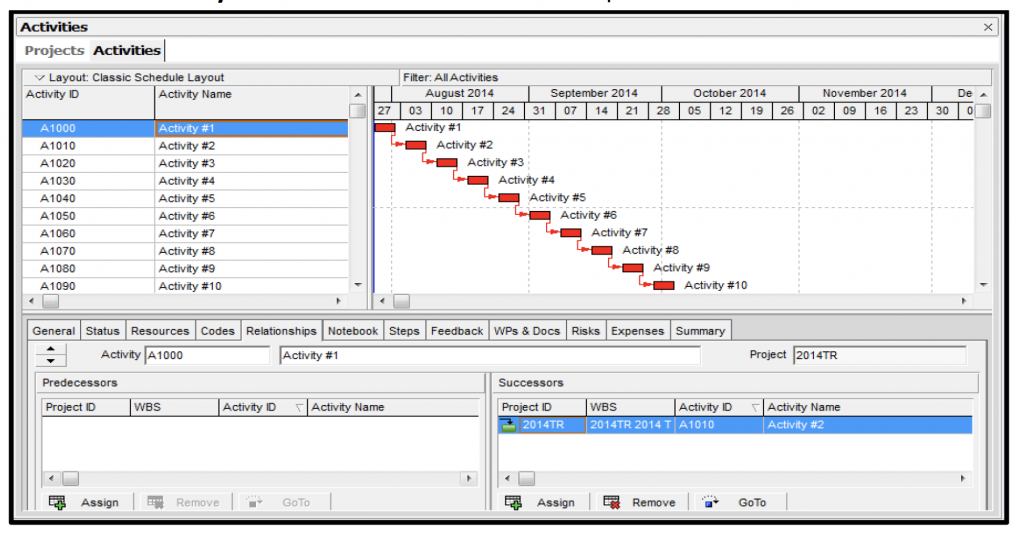
- In the Successor box, select the Successor to be removed – Click Remove – This will remove the relationship between the two activities.
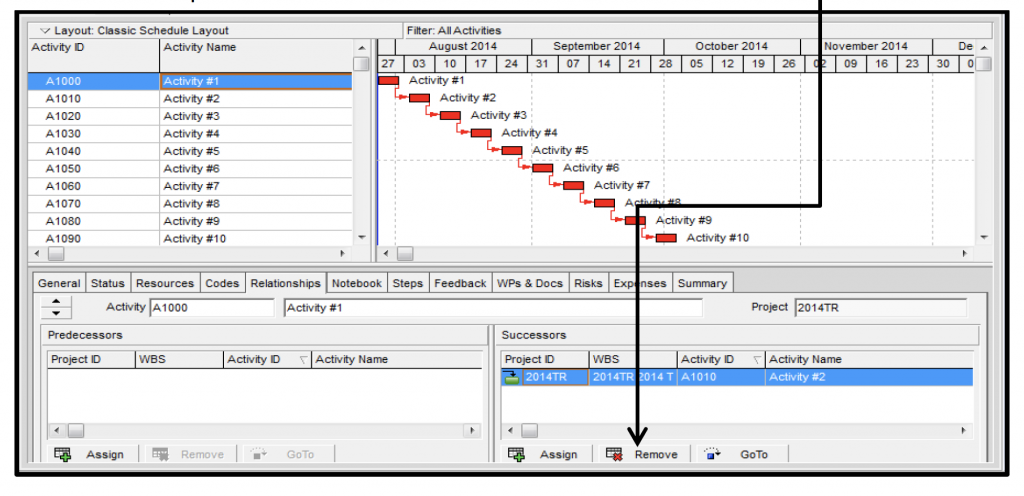
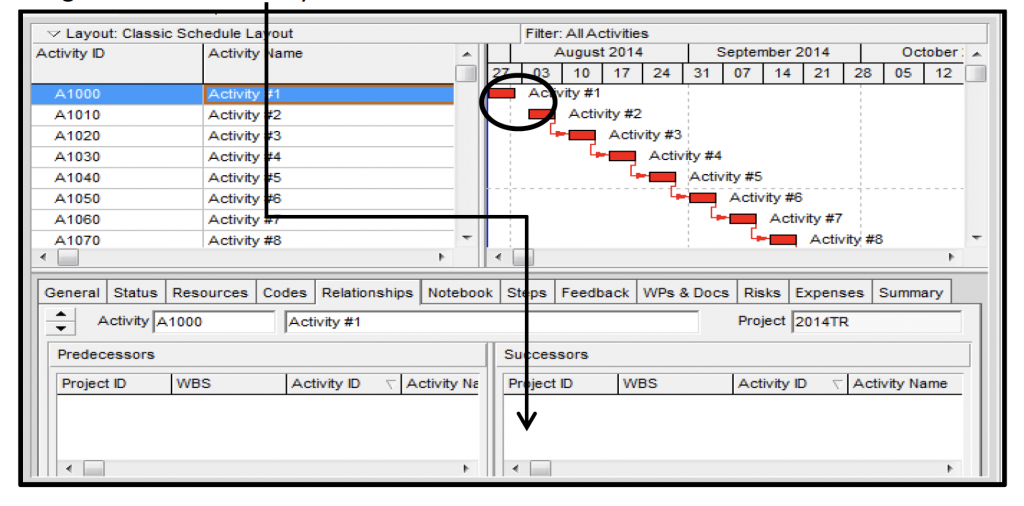
4. Logic has been removed. The relationship line between Activity #1 and Activity #2 is no longer there and Activity #2 has been removed from the Successor box.
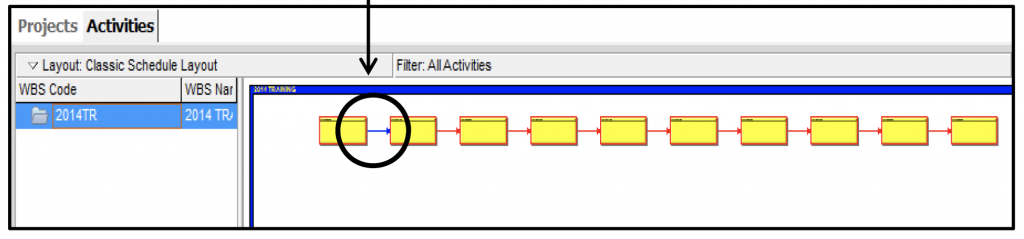
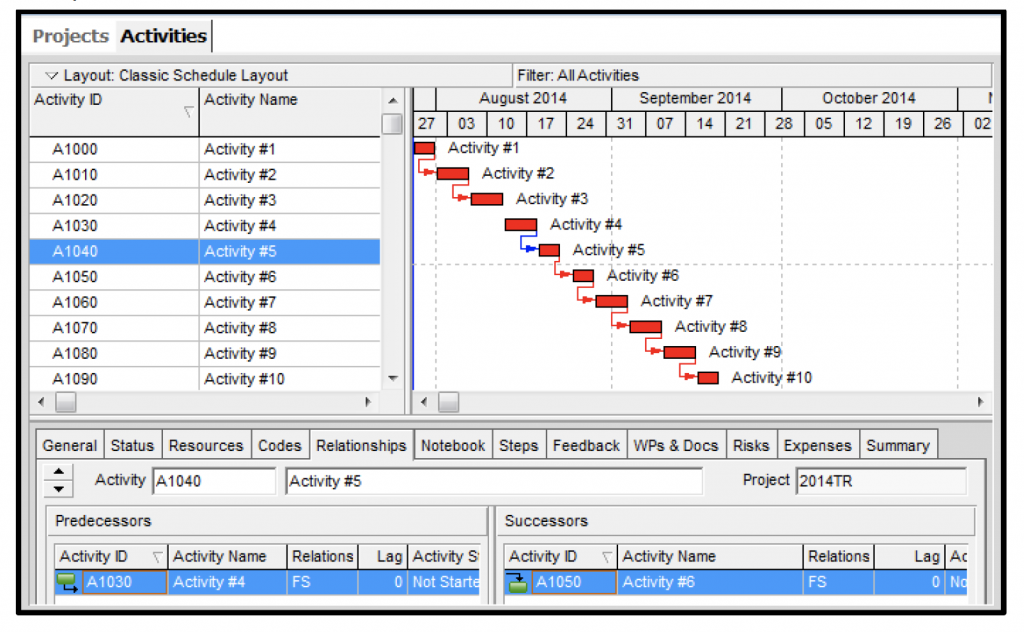
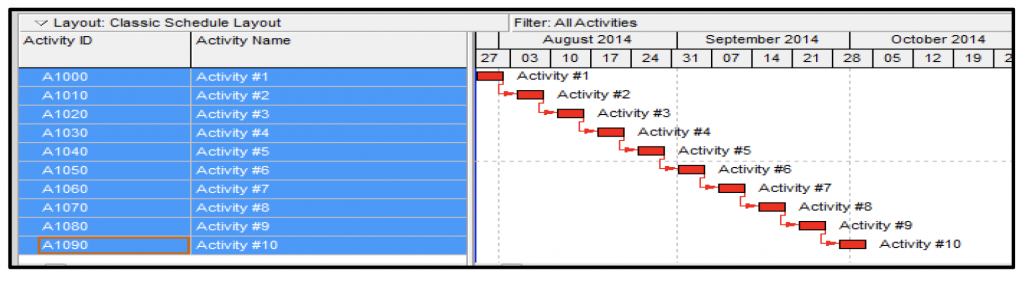
Method #2 – Using the cursor and delete key on your keyboard
- Move the cursor under the applicable relationship line until a white arrow appears.
- Left click once and the relationship line will turn blue.
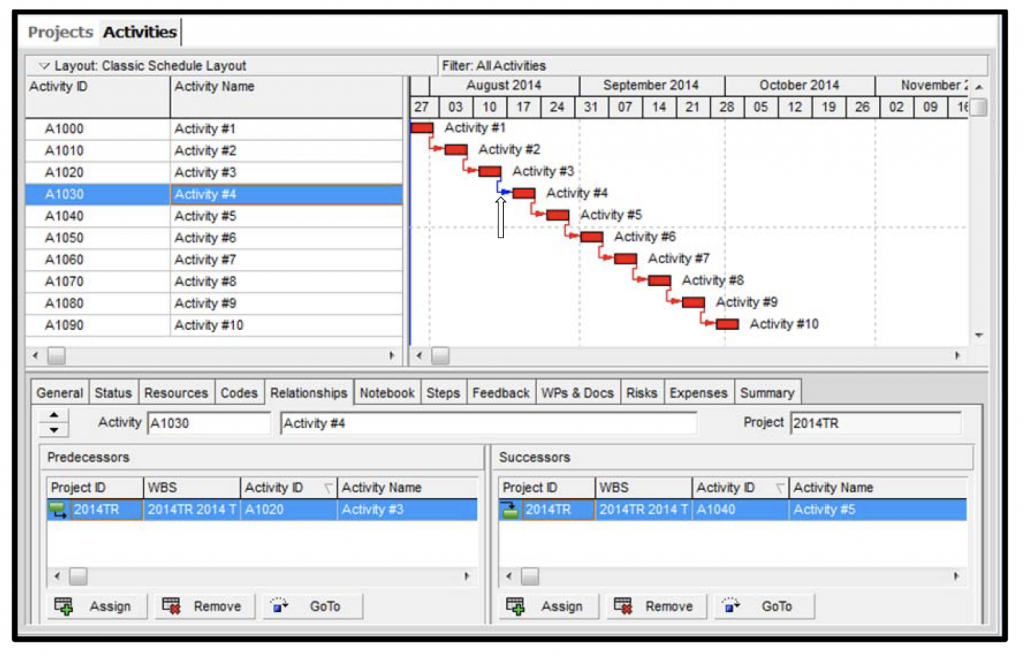
- Press Delete and then Enter on the keyboard and it will remove the relationship between the two activities.
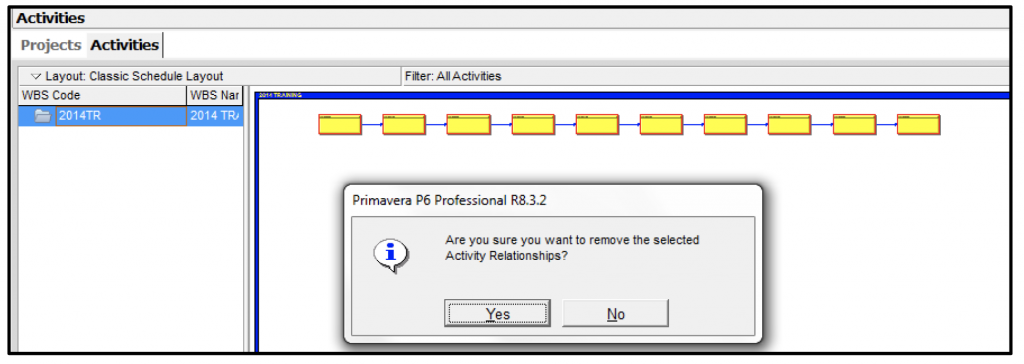
- By continuing to press Delete and Enter the cursor will move down to the next relationship.
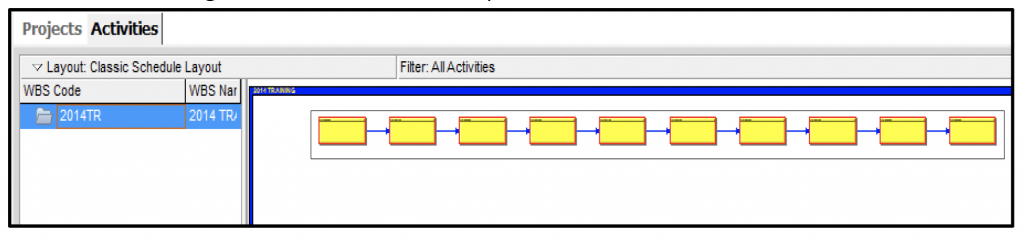
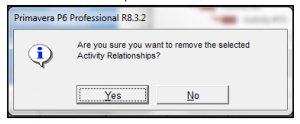
6. Press the delete key. Click “Yes” to remove the relationships between the activities.
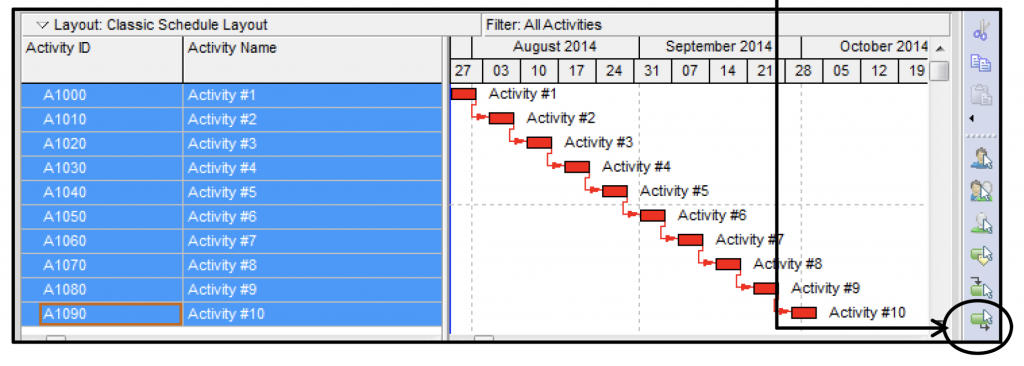
Method #4 – Using Successor button
1. Select all the activities
2. Click the Successor button on the right side toolbar
Utilizing Different Methods to Remove Logic in PrimaveraTM P6
- Highlight all the activities and click

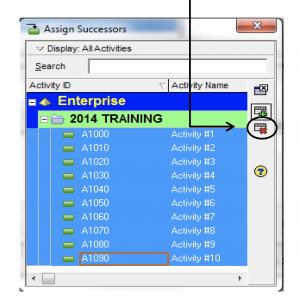
4. Click “Yes” to remove the relationships between the activities.
5. Close the Assign Successors dialogue box.
Congratulations you have successfully completed four methods for removing logic.

Jun 1, 2020 | Documentation
Understanding Lag
Lag is a duration that is applied to a dependency to make the successor start or finish earlier or later. Lag can be positive or negative and it is based on the calendar of the successor activity.
Most common method of using lag
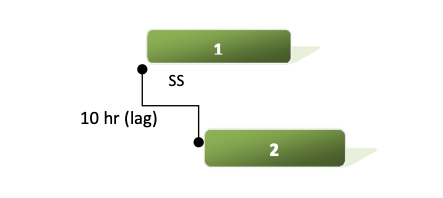
- Activities with a start to start relationship, which will not start exactly the same time
- Activity 2 starts 10 hrs after Activity 1
Refrain from using negative lag – has a direct impact on total float values
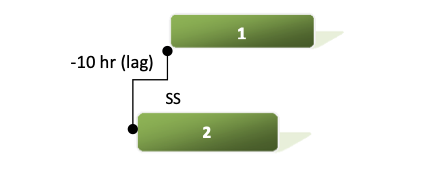
Refrain from pushing activities apart with lag

- It is difficult to keep up with and could potentially have an impact on critical path
- When the predecessor is complete lag will not be maintained
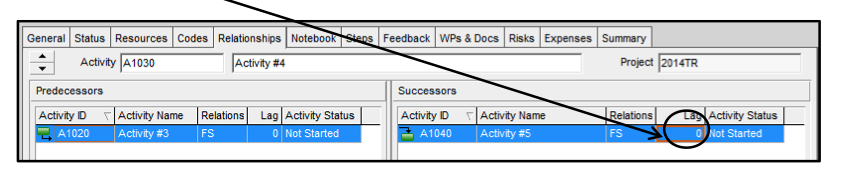
Managing Lag Utilizing a Time Delay Activity in Primavera P6
Using lag could potentially push the Finish Milestone and impact critical path. This is very hard to manage and visually see in the Gantt Chart. Let’s add 10 days of lag after Activity #4.
- To do this, click on the Activity #4.
- The successor to Activity #4 is Activity #5.
- In the Successor box add 10 in the lag box.
- Click F9 to schedule.
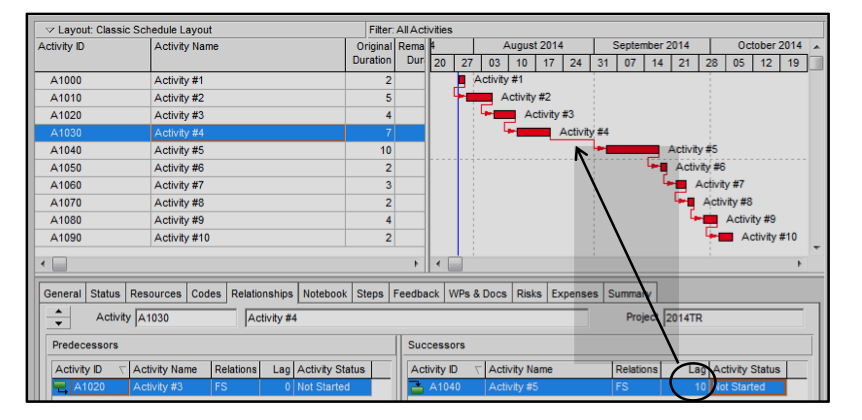
As you can see above, it would be very hard to see where lag is in a schedule unless you chased logic or run a lag report.
Disadvantages of lag:
- When predecessor is complete lag will not be maintained
- Could potentially push the Finish Milestone and impact critical path
- Very hard to manage and visually see in the Gantt Chart
Managing Lag Utilizing a Time Delay Activity in Primavera P6
A Time Delay activity is suggested and another option to use in the place of lag.
Advantages of using a Time Delay activity:
- A controlled activity that can extend or contract based on management decisions
- Most planners do not plan this, it’s up to the scheduler to manage
- You can make it visual in the Gantt Chart
- You can manage it and control the amount of total float
- Aids in leveling resources on non-critical activities
- Color coded for easy identification in the Gantt Chart
- Can filter for all “time delays” and see overall “cushion” in the scheduleNow let’s remove the 10d lag, click F9 to schedule, and add a Time Delay activity in the place of lag.
1. To add a time delay activity you’ll first need to add a 10d activity and rename to Time Delay – Training Activity.
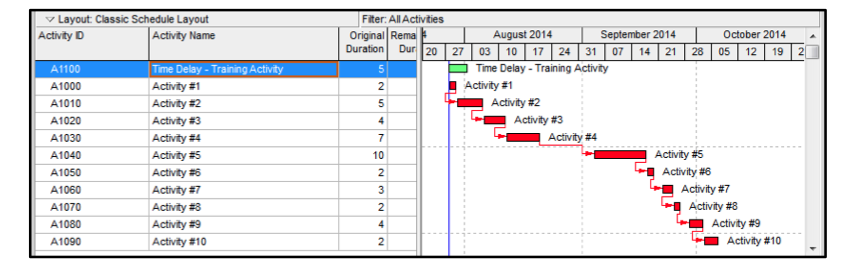
2. Next you’ll need to create a FS relationship from Activity #4 to Time Delay to Activity #5.
Managing Lag Utilizing a Time Delay Activity in Primavera P6
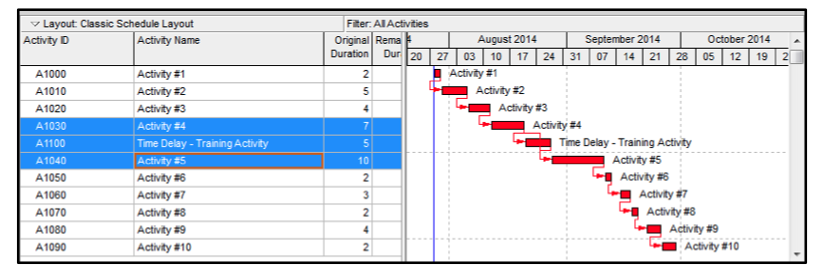
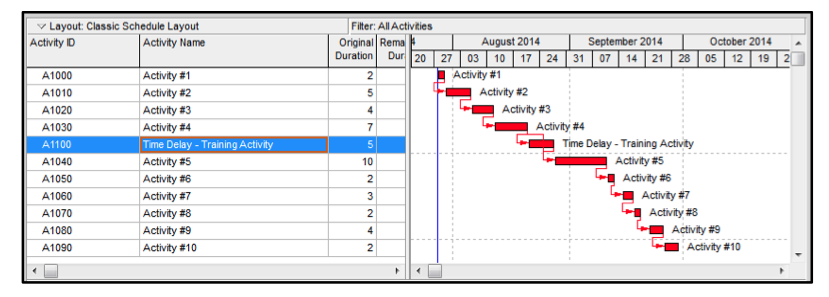
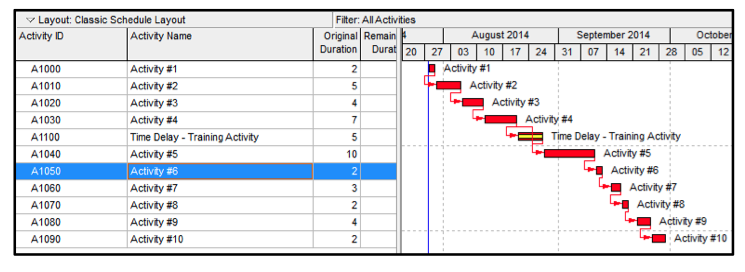
- Once you’ve tied the logic, you’ll click F9 and sort by start date
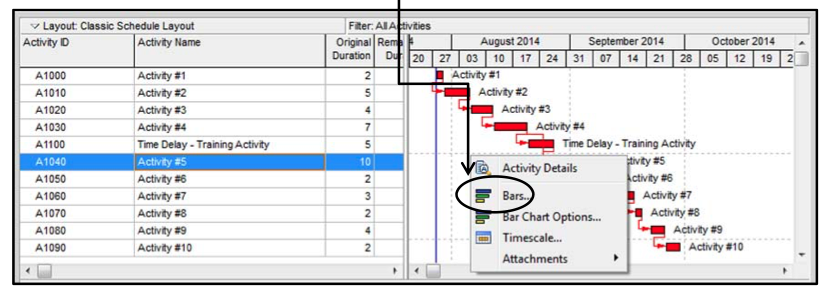
- Now that we’ve added the Time Delay activity, let’s create a Time Delay bar to make it easier to see in the Gantt Chart
5. Right click in your Gantt Chart and select Bars
Managing Lag Utilizing a Time Delay Activity in Primavera P6 6. Next click Add and name bar Time Delay

- Next a Time Delay filter will need to be created within Bars
- On the Time Delay bar click All Activities under the Filter column

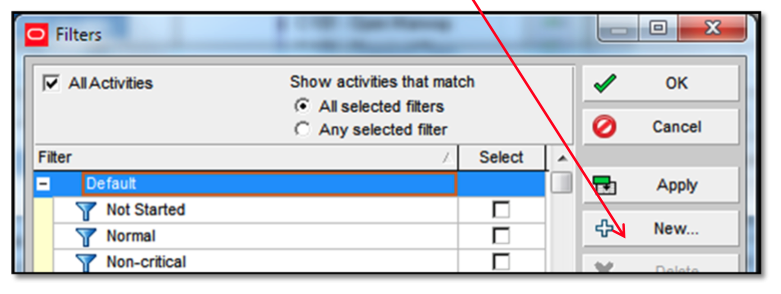
9. The Filters dialogue box will appear and you’ll click New
Managing Lag Utilizing a Time Delay Activity in Primavera P6
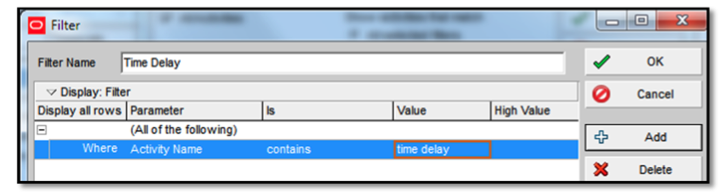
- Name the filter and complete the parameters with Where Activity Name contains Time Delay
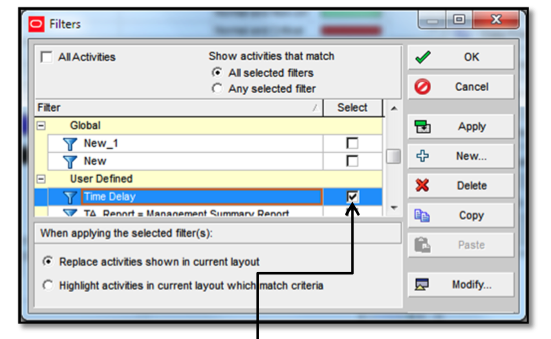
- The new Filter will show under grouping User Defined
- Make sure the Filter is checked and click OK
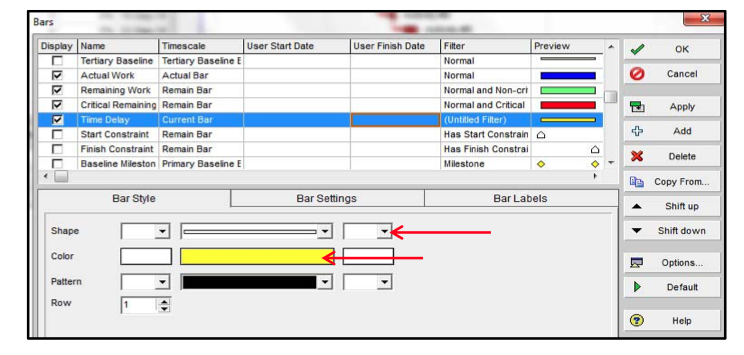
- Under the Bar Style tab change the color of the bar by double clicking Color
- Under the Bar Style tab change the Shape of the bar by selecting the arrow and choosing the second bar from the bottom
Managing Lag Utilizing a Time Delay Activity in Primavera P6
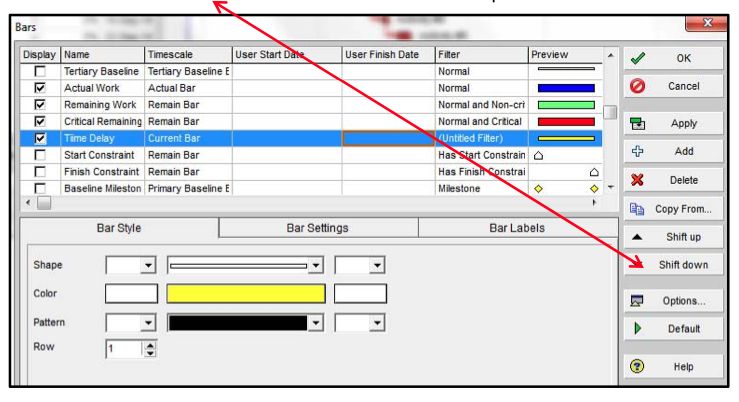
15. To view the bar in the Gantt chart you’ll have to move the Time Delay bar below the Critical Remaining bar
16. To do this use the Shift down button and then click OK to accept
Congratulations you have created a controlled Time Delay activity to better manage your project rather than using lag.
Jun 1, 2020 | Documentation
To filter for activities within a specific timeframe, create the following filter:
For this example, the timeframe is August 28, 2005, through September 3, 2005. When creating your filter, substitute the appropriate dates as necessary.
- Create a new filter by choosing View, Filters, and click on New.
- Enter the following selection criteria:
- Where Start is less than or equals
- Where Finish is greater than or equals
What this filter will return:
Activities that have ANY time scheduled during the specified timeframe. It may give activities that are in progress if they are scheduled on the specified date
What this filter will not return:
Activities that FINISH before 28AUG05 or START after 03SEP05.
Note: If you do not see the “Time” in your Value fields, choose Edit, User Preferences, Dates Tab, Time Section, and select either the 12 or 24-hour time format.

Jun 1, 2020 | Documentation
Goal: How to copy the WBS structure from an existing project into a new project.
There are two ways to copy the WBS information from one project to another.
Project that has the WBS structure already in the database
- Open both projects and choose Project, WBS.
- Go to View, Group and Sort By. Choose Default.
- Highlight the WBS structure to copy. Right-click and choose Copy.
- Click on the project to copy the WBS into and right-click and choose Paste.
- Uncheck all the boxes in the Copy WBS Options box (unless you want to copy assignments over also).
- Click OK.
Project that has the WBS structure, but is not in the database
This procedure assumes you have an XER of the project to copy the WBS structure from.
- Open the project that is going to receive the WBS structure.
- Choose File, Import.
- Follow the prompts until you reach the Import Project Options:
- At this stage of the import, choose “Update Existing Project” and also choose the correct project in the “Import To” section.
- Click Next.
- Click Yes if you receive a message about the Unique Internal Identifier not matching.
- The next screen should appear:
- Click on “Add”.
- Enter a name for the new configuration.
- Click on Modify.
- The Modify Import Configuration dialog should appear:
- This screen will allow you to choose what Data Items you can import from the XER into the project. Click on the “Keep Existing” and change them to “Do Not Import” for all of the items you do not want to import.
- Ensure that Projects and WBS are changed to Insert New and click OK.
- The following window will appear:
- You will have to click in the “Use” column for the WBS Only configuration to be changed to “Yes”.
- Click Next.
- Click Finish.